Management portal
Fleet overview, performance, inventory, groups, licenses and administrative context. File listings are read-only.

Review CPU, memory, system storage, network activity and running processes together before deciding what the endpoint needs.
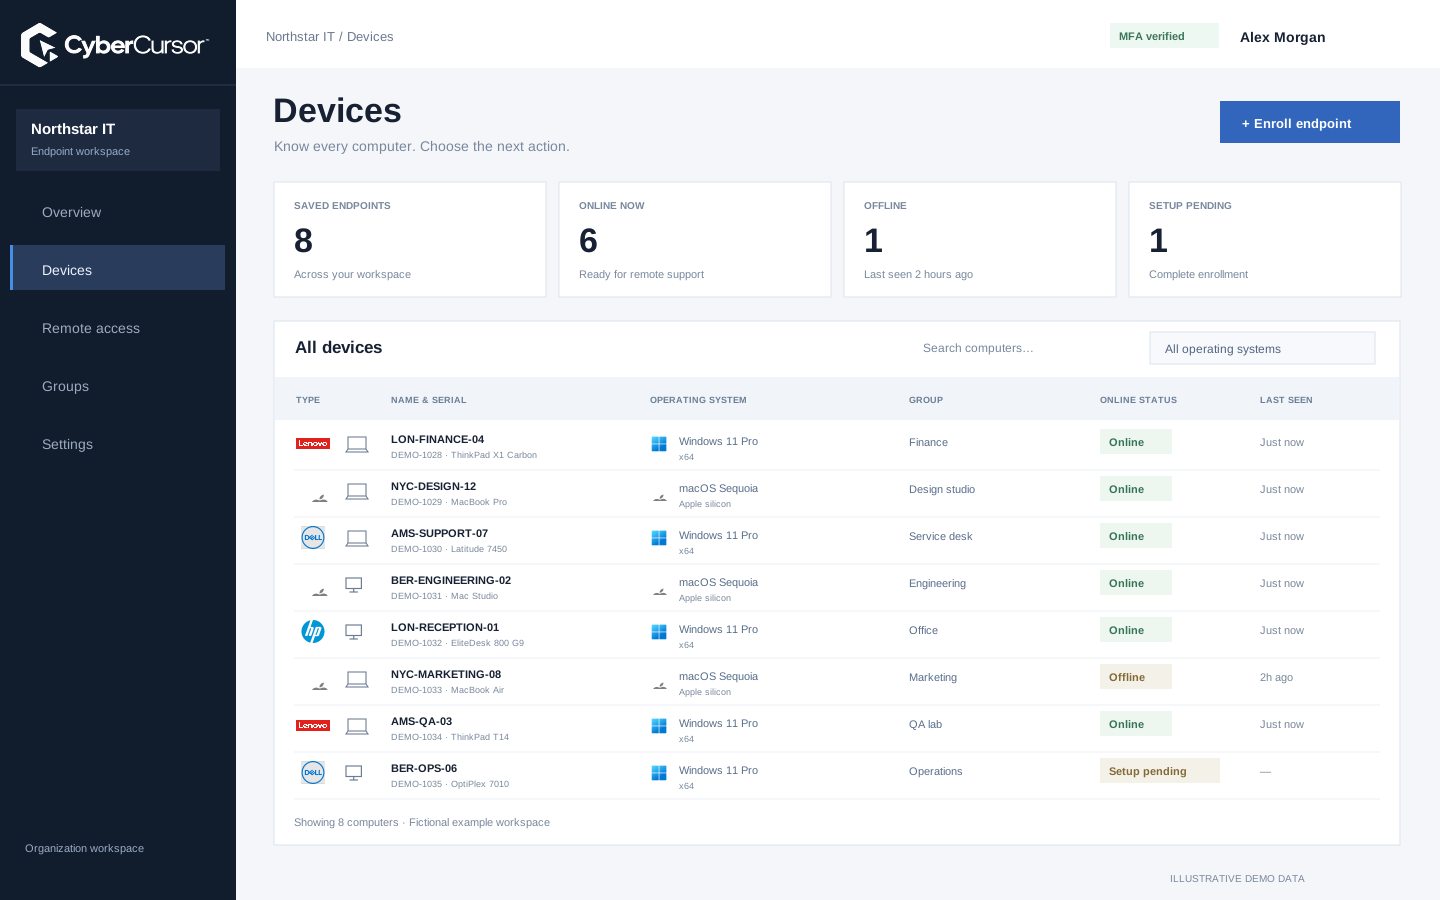
A CPU percentage on its own rarely explains why someone cannot work. CyberCursor brings performance context into the endpoint profile so the operator can review memory, storage, processor activity and network counters together. Begin with availability and report freshness, then compare the resource cards with the running-process list. A busy processor with low free memory suggests a different investigation from a nearly full system volume or an unavailable network sample. The profile supports this sequence without presenting an automatic diagnosis as fact. It also keeps device identity nearby, so a technician can relate observed pressure to the machine model and installed operating system. Use the web portal to understand the situation; switch to CyberCursor Remote when the investigation requires direct screen, terminal or file changes.
Resource consumption becomes more actionable when the operator can connect it to reported processes. The endpoint view includes process observations alongside CPU and memory measurements, helping the team identify which application deserves closer investigation. Compare the timestamp of the process report with the time of the resource reading before assuming they describe the same moment. A high value may be expected during an update, a backup or a workload the employee deliberately started. CyberCursor does not fabricate optimization advice or yesterday-to-today comparisons where there is no supporting history. Record the symptom, identify the relevant process and determine whether it is safe to intervene. If a command is needed, use the installed controller and an appropriately authorized administrator account rather than turning a dashboard observation into an unreviewed action.

Processor activity
Working memory
Used capacity
Storage pressure should be measured against the volume that matters to the operating system, not a misleading sum of every mounted path. The profile identifies the reported system volume for the storage card and keeps additional hardware observations available in the specifications view. This avoids treating mount points that share capacity as independent disks. When available space is low, use the file explorer to inspect a relevant directory and establish what is occupying it. The portal provides read-only browsing and downloads; uploads, folder creation, renaming and removal require the installed controller. Decide who owns the files and how the change will be verified before deleting anything. Storage reporting helps prioritize the investigation, but it does not replace a retention policy, a backup system or an approved cleanup plan.
Fleet overview, performance, inventory, groups, licenses and administrative context. File listings are read-only.
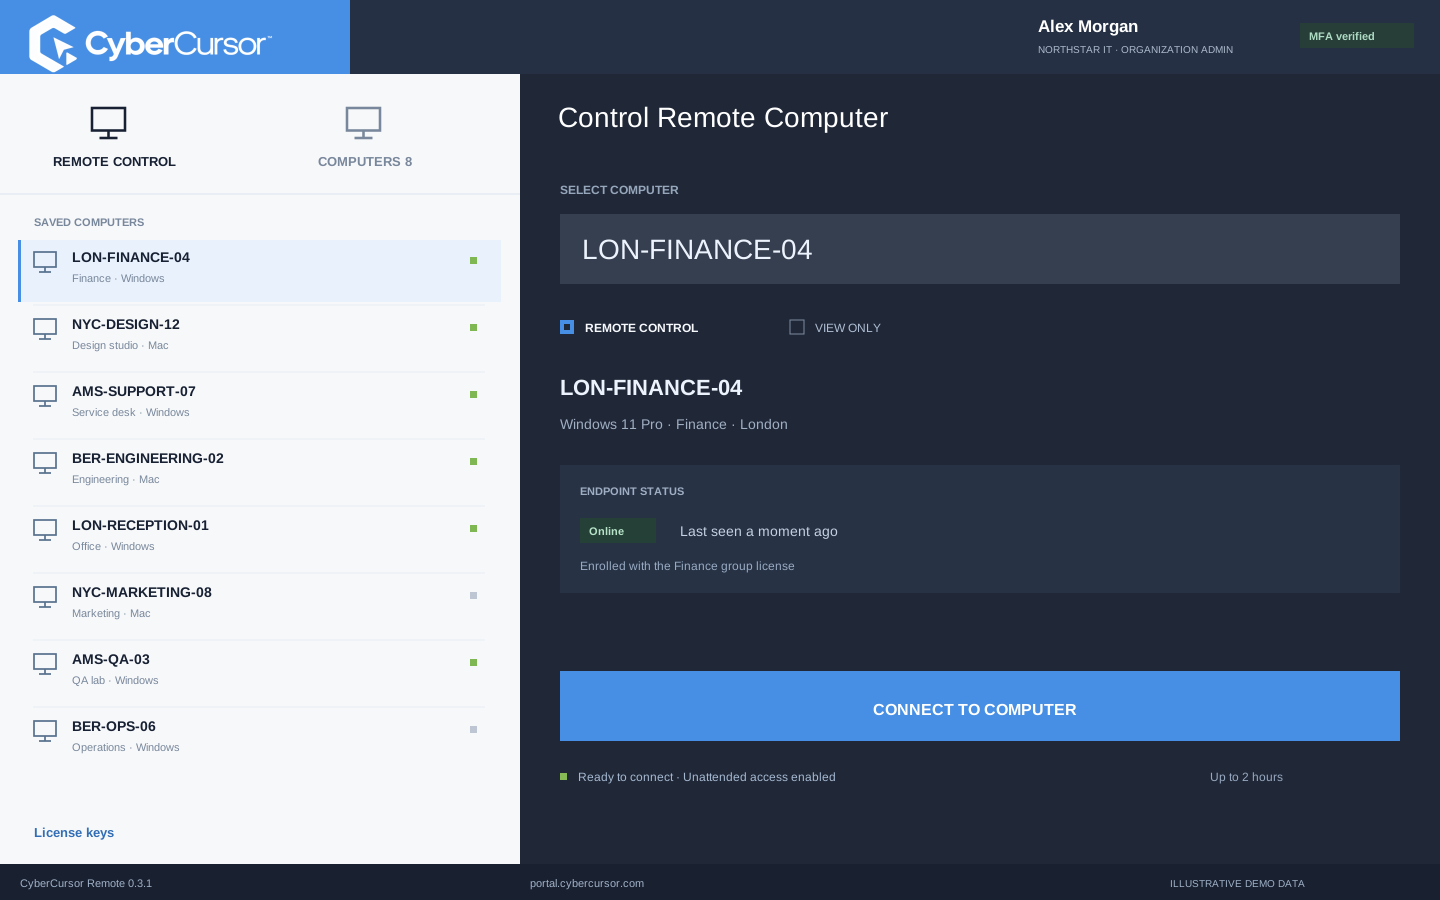
Windows and Mac apps for interactive screen access, terminal commands and bounded file modifications.
Identity, reports and authorized actions on the owned computer. Availability depends on endpoint readiness and OS permissions.
Endpoint receive and transmit rates describe observed traffic over reporting intervals. They are useful context for a slow application, but they are not a promise about the bandwidth a user can obtain from an internet connection. Initial samples can be unavailable until the agent has enough counter history, and receive and transmit measurements are handled independently. Review the collection time and recent sequence before interpreting a quiet link as a network failure. A disconnected endpoint cannot provide a current traffic measurement. Combine the agent observations with the application symptom and your own network diagnostics when necessary. The goal is to identify the next useful check: local resource pressure, connectivity, a remote service or an application issue. Avoid treating a single counter as a complete network-performance assessment.
A performance chart is most useful when its horizontal axis represents actual collection times. CyberCursor uses report timestamps and leaves gaps where measurements are missing. The endpoint inspector presents recent history on a sixty-minute axis so the operator can relate a resource change to the period under investigation. Missing reports are not smoothed into reassuring values, and old samples are labeled as last known. This makes a disconnected laptop distinguishable from an idle connected machine. Review the history alongside the availability state before comparing readings across devices. The current pilot supports this endpoint investigation workflow; long-term capacity forecasting, configurable alert thresholds and fleet-wide performance service commitments require separate evaluation. Start by checking whether the short-term history answers the support questions your team handles most frequently.
Organizations, clients and high-level administration.
Assigned endpoints, groups, enrollment keys and operational workflows.
Explicitly shared endpoints with a scoped expiry, rather than whole-client access.
For an evaluation, ask a user to describe a real support symptom and note its approximate time. Open the owned test endpoint, verify fresh reporting and inspect CPU, memory, system storage and the relevant processes. Record what you observed before opening CyberCursor Remote, then make only the agreed change. After the action, check that the endpoint reconnects and collect a new report rather than assuming that a closed terminal means the issue is resolved. Keep the before-and-after observations with the support ticket. This creates a repeatable workflow that separates observation, intervention and verification. The published interface illustrations contain fictional data; a real enrolled Windows or Mac agent is needed to test performance reporting. Contact connect@cybercursor.com if you want to define acceptance checks for your own workload.
Operational details matter as much as the interface.
No. The pilot reports observed endpoint receive and transmit activity. Internet speed testing and network diagnostics are separate checks.
The operating system may not provide it, the first rate sample may lack a previous counter, or the report may be stale. Unavailable is distinct from zero.
Interactive screen, terminal and file changes require CyberCursor Remote and the relevant permissions. The portal provides observation and administrative workflows.
The current profile avoids unsupported optimization claims and invented daily comparisons. Operators interpret the reported observations within their own support workflow.
Connect this workflow to the rest of your endpoint workspace.
Understand Windows and Mac endpoints with hardware, operating-system, software and identity details in one client workspace.
Explore FEATURESPILOTInvestigate CPU, memory, storage, network and process activity with endpoint reports and clear freshness.
Explore FEATURESPILOTBrowse endpoint folders in the portal and use CyberCursor Remote for authorized file uploads and modifications.
ExploreStart with a conversation about your fleet, your workflows, and a controlled pilot.